
Author: Vigor Forty Editorial Team
Medically Reviewed By: Editorial Review Board
Disclaimer: This article is for informational purposes only and is not a substitute for professional medical advice. Consult your physician before interpreting health data or making changes to your exercise program. Read our full Medical Disclaimer.
📌 Key Takeaways
- The Scale Is the Worst Metric for Tracking Cardio Progress: Body weight fluctuates daily due to hydration, glycogen, and hormonal shifts. It masks the profound, health-extending adaptations happening inside your body—lower resting heart rate, improved VO2 max, increased mitochondrial density, and better insulin sensitivity. Tracking these internal metrics tells the true story of your fitness journey.
- Resting Heart Rate (RHR) Is Your Daily Recovery Dashboard: A declining RHR over weeks and months is one of the clearest signs of improved cardiovascular fitness. A sudden, sustained spike of 5+ bpm above your baseline signals accumulated stress, poor recovery, or impending illness—and it’s your cue to prioritize rest over intensity.
- Heart Rate Variability (HRV) Decodes Your Nervous System: A higher HRV generally indicates a well-recovered, parasympathetic-dominant state ready for training. A downward trend suggests your body is under stress and needs a lighter day. Tracking HRV alongside RHR provides a powerful, personalized guide for when to push and when to back off.
- The Best Field Tests Are Simple, Repeatable, and Revealing: You don’t need a lab to measure progress. The 12-minute Cooper test (for walkers/runners), a 2,000-meter rowing time trial, a 1-mile ruck for time, or simply tracking your pace at a fixed heart rate on your favorite Zone 2 loop are accessible, accurate-enough methods for gauging improvements in your aerobic engine.
- Trends Over Data Points, Always: One “bad” workout or a single night of poor HRV means nothing. The magic is in the trend over weeks and months. A consistent, gradual improvement in any of these metrics is the true signal of a successful, sustainable cardio program.
Introduction: The Stories Your Body Is Telling You
You’ve been consistent. You’ve logged the Zone 2 miles, endured the HIIT intervals, lifted heavy, and prioritized your sleep. You feel better—more energetic, less stressed, stronger. But a nagging question might linger: Is this actually working?
For too many Americans over 40, the answer to that question is sought in the mirror or on the bathroom scale, both of which are notoriously deceitful narrators. The scale doesn’t know that you’ve gained two pounds of muscle and lost three pounds of visceral fat. It doesn’t register that your heart now pumps more blood with each beat, that your mitochondria are burning fuel more cleanly, or that your insulin sensitivity has dramatically improved. Relying on the scale for validation is like judging the quality of a book by its weight—you miss the entire story.
The true story of your cardiovascular transformation is written in data points that are easily accessible to you. Your resting heart rate, your heart rate variability, your pace at a given heart rate, your recovery rate after an interval, and your performance in a simple, repeatable field test—these are the metrics that matter. They are the objective, physiological evidence of your body’s adaptation to the training stimulus you’ve been applying.
This guide is your dashboard manual. It explains each of these key metrics, how to measure them without a PhD or an expensive lab, what the numbers mean, and—most importantly—how to use them to guide your training on a daily, weekly, and monthly basis. By the end, you’ll stop guessing and start knowing. You’ll see the quiet, powerful progress unfolding beneath your skin, and that knowledge will be the fuel that keeps you consistent through the busy, chaotic decades of midlife.
Section 1: The Metrics That Matter—Your Cardiovascular Vital Signs
Forget the scale. These are the numbers that reflect your true health and fitness.
1. Resting Heart Rate (RHR)
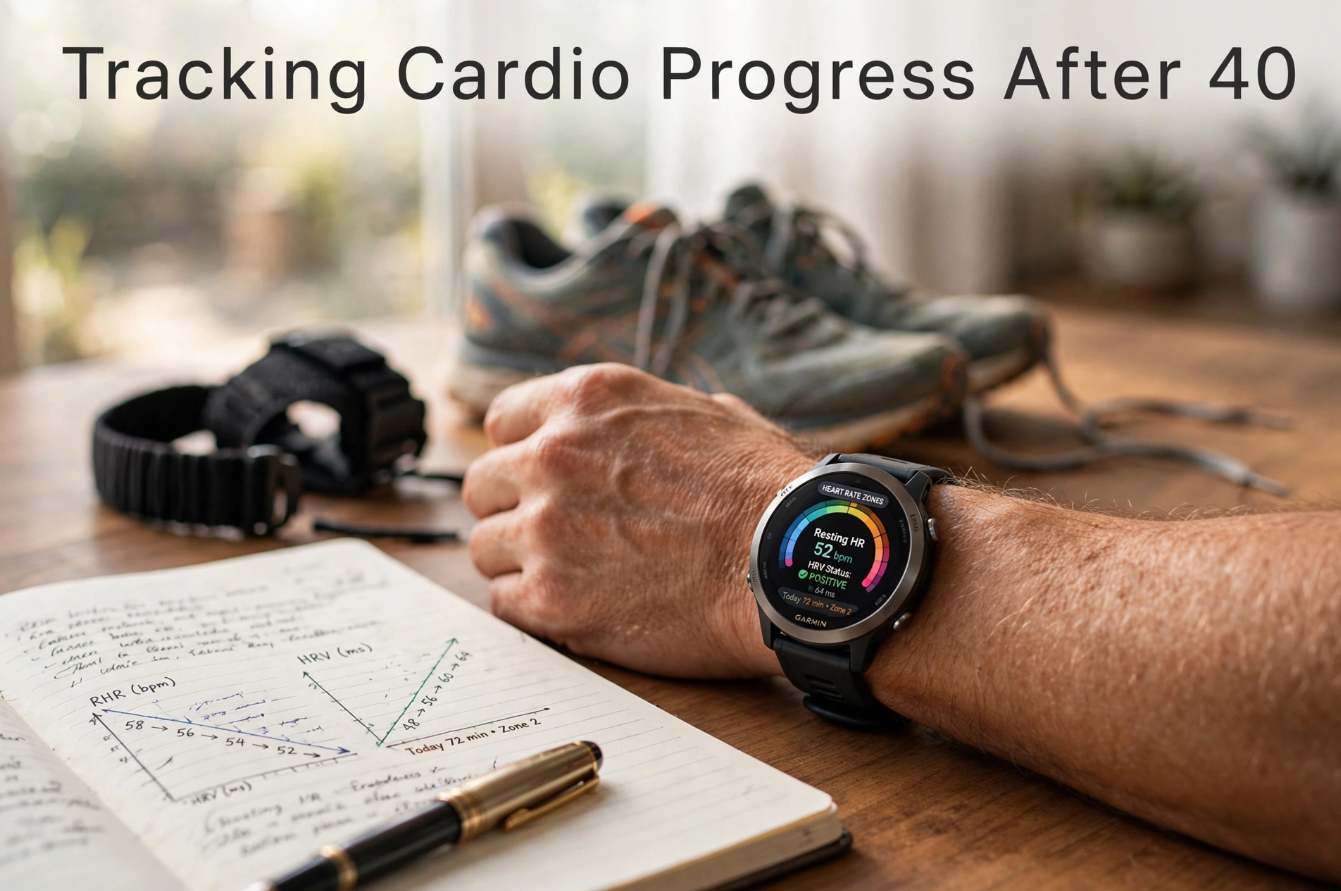
Your RHR is the number of times your heart beats per minute when you are completely at rest. A normal adult RHR is 60–100 bpm, but a fit individual over 40 might see numbers in the 50s or even 40s. As your heart muscle strengthens from consistent cardio, your stroke volume (blood pumped per beat) increases. A more powerful heart doesn’t need to beat as often to circulate the same amount of blood.
- How to Measure: The most accurate method is to wear a chest strap or a reliable wrist-based monitor immediately upon waking, before you get out of bed or check your phone. Lie still for 2–3 minutes and note the lowest sustained reading. Do this consistently for a week to establish your baseline.
- The Trend to Watch For: A slow, steady decline in your morning RHR over weeks and months is a hallmark of improving aerobic fitness. A sudden, sustained increase of 5–10 bpm over your baseline for two or more days is a red flag for overtraining, stress, dehydration, or an oncoming illness. This is your body telling you to prioritize rest and recovery.
2. Heart Rate Recovery (HRR)
Heart Rate Recovery is the drop in your heart rate in the minute or two immediately following intense exercise. It’s a powerful proxy for how well your parasympathetic nervous system (your “brake”) can re-engage. A faster recovery indicates a well-conditioned, responsive cardiovascular system.
- How to Measure: After a hard interval session or at the end of a VO2 max effort, note your peak heart rate. Then, immediately stand still or sit quietly and note your heart rate exactly one minute later. The difference is your 1-minute recovery.
- The Trend to Watch For: A recovery of less than 12 bpm in the first minute is a concerning sign. A recovery of 15–25 bpm is typical. A recovery of over 30 bpm is excellent. As you get fitter, this number should increase.
3. Heart Rate Variability (HRV)
HRV is the variation in the time interval between heartbeats. A healthy heart doesn’t beat like a metronome; it has subtle variations controlled by the autonomic nervous system. High HRV indicates a flexible, responsive nervous system with strong parasympathetic tone—you’re well-recovered and ready for stress. Low HRV indicates sympathetic dominance—your body is in a state of stress and needs rest.
- How to Measure: Most modern wearables (Garmin, Whoop, Oura, Apple Watch) calculate HRV automatically during sleep or upon waking. You don’t need to interpret the raw millisecond number; focus on the trend relative to your own baseline.
- The Trend to Watch For: A stable or increasing HRV trend is green lights for training. A significant, sustained drop in HRV is a yellow or red light—consider reducing intensity or taking a rest day, even if your planned workout is “on the schedule.”
Section 2: The Power of Pace-at-a-Fixed-Heart-Rate (Aerobic Efficiency Tracking)
This is one of the most pure and motivating ways to track your aerobic progress, and it requires no lab, no maximal efforts, and no complex calculations.
The Concept:
Choose your favorite, repeatable Zone 2 course—a flat 5K loop in your neighborhood, a specific route on your local bike trail, a 2,000-meter piece on your rower. Perform this route once every 4–6 weeks, keeping your heart rate locked strictly at the top of your Zone 2 range. Record your time, pace, or distance covered.
What It Tells You:
As your mitochondrial density, capillary network, and stroke volume improve, your body becomes more efficient at a given heart rate. You will be able to run, ride, ruck, or row faster at the same heart rate. If your 5K Zone 2 run time drops from 35 minutes to 32 minutes at a constant 130 bpm, that’s a profound and undeniable marker of improved aerobic fitness.
Section 3: Simple, Repeatable Field Tests for Every Modality
Every 8–12 weeks, perform one of these tests to benchmark your progress. Do them under similar conditions (time of day, hydration, sleep, surface).
The 12-Minute Cooper Test (For Walkers and Runners)
- What: Cover as much distance as possible in 12 minutes on a flat, measured course (a high school track is ideal). You can walk, run, or mix both.
- Metric: Distance covered. An increase over time is a direct reflection of improved cardiovascular fitness and can be plugged into formulas to estimate VO2 max (as detailed in our VO2 Max Guide).
The 2,000-Meter Row (For Rowers)
- What: Row 2,000 meters as fast as you can on a Concept2 rower with the damper setting between 4–6.
- Metric: Time. This is the gold-standard rowing benchmark. It’s brutally honest and reveals the full integration of your cardiovascular and muscular endurance.
The 1-Mile Ruck (For Ruckers)
- What: Using a consistent ruck weight (e.g., 30 lbs), walk 1 mile as fast as you can on a flat course.
- Metric: Time. As your cardiovascular fitness and rucking-specific strength improve, your time will drop.
The 30-Minute Bike Time Trial (For Cyclists)
- What: On a stationary bike or a flat, uninterrupted outdoor loop, ride as far as you can in 30 minutes at a maximal sustainable effort.
- Metric: Distance covered. Improved power output and aerobic capacity will translate to a greater distance.
Section 4: The Data-Informed Training Week
This is how you use the metrics in real-time.
The Morning Check-In (2 Minutes):
Upon waking, look at your wearable’s overnight summary.
- RHR is normal or low, HRV is normal or high: Green light. Proceed with your planned session. Your body is ready to absorb training stress.
- RHR is elevated by 5+ bpm, HRV is trending down: Yellow light. You are accumulating fatigue or stress. Proceed with your scheduled session only if it’s an easy Zone 2 day. If it was a planned HIIT or heavy leg day, swap it for a 45-minute Zone 2 session or an active recovery walk.
- RHR is significantly elevated, HRV has dropped sharply, and you feel tired or irritable: Red light. Take a full rest day or do a gentle 20–30 minute mobility flow. Do not train. Your body is telling you it’s on the edge of breakdown or illness. One day off now prevents two weeks off later.
The Post-Workout De-Brief:
After a hard session, glance at your 1-minute heart rate recovery. If it’s strong (e.g., 25+ bpm drop), your session was productive and your nervous system is responding well. If it’s poor (e.g., <12 bpm drop), note it in your training log. A pattern of poor recovery after normally manageable workouts is a sign of overreaching.
Section 5: The Monthly and Quarterly Review
Once a month, sit down for 15 minutes and look at your data trends.
- Plot your morning RHR trend line. Is it slowly declining, stable, or rising? A declining trend is your trophy.
- Revisit your field test results. Even a 2% improvement in your Cooper test distance or a 5-second drop in your 2K row time is a significant victory.
- Look at your subjective data. How are your energy levels? How is your mood? How is your sleep quality? These qualitative measures are as important as the quantitative ones.
- Adjust your training plan. Based on the trends, do you need more Zone 2 volume? A slight increase in intensity? An unscheduled deload week? The data gives you the confidence to make these adjustments intelligently.
Section 6: FAQ—Your Progress Tracking Questions Answered
Q: My smartwatch tells me my VO2 max hasn’t changed in three months. Am I not making progress?
A: Wrist-based VO2 max estimates can be inaccurate and slow to respond. Do not let a stagnant watch number discourage you. Rely on the field test and the pace-at-a-fixed-heart-rate test. If you are running faster at the same heart rate, your aerobic fitness is absolutely improving, regardless of what the watch’s algorithm says.
Q: I’m a woman. Does my menstrual cycle or menopausal status affect these metrics?
A: Yes, significantly. RHR and HRV fluctuate across the menstrual cycle, and they can be more variable during perimenopause. The key is to track your trends over a full month or more, and to compare your current month to the same phase of your cycle last month. Do not compare your mid-luteal phase RHR to your mid-follicular phase RHR; always compare like with like. The trends over longer time frames are the reliable signal.
Q: I don’t use wearables. Can I still track progress?
A: Absolutely. A manual morning pulse count and a simple field test every 8 weeks are all you truly need. The 12-minute Cooper test and the subjective assessment of how you feel on your daily walk or run are free, valid, and have been used by athletes for decades. Wearables add convenience and granularity, but they are not essential.
The VigorForty Take
Data, when used wisely, is not a source of anxiety; it’s a source of empowerment. It removes the guesswork and the emotional rollercoaster of relying on the mirror. It gives you a clear, objective window into the incredible, invisible transformation your body is undergoing in response to your consistent effort. That lower resting heart rate is a whisper from your heart saying, “Thank you, I’m stronger now.” That faster split time on your Zone 2 loop is your mitochondria singing in chorus. That faster heart rate recovery is your nervous system learning to dance smoothly between stress and calm.
Track the right metrics. Trust the trends. Let the data guide your decisions, but never let a single number define your worth. You are not a dashboard. You are a living, breathing, adapting human being on a lifelong journey. These metrics are simply the mile markers on that road, confirming you’re heading in the right direction. Now, check your pulse, lace up your shoes, and go collect some more beautiful, affirming data.
Read All Related Articles
- The Complete Guide to Zone 2 Training After 40: How Low-Intensity Cardio Boosts Fat Loss, Longevity, and Endurance
- The Complete Guide to HIIT After 40: Joint-Friendly Workouts That Torch Fat and Protect Your Heart
- The Complete Guide to Running After 40: How to Start, Stay Injury-Free, and Build Lifelong Endurance
- The Complete Guide to Metabolic Health After 40: Reverse Insulin Resistance, Burn Stubborn Fat, and Reclaim Your Energy with Cardio
- The Complete Guide to Cardio Recovery After 40: How to Rest, Rebuild, and Come Back Stronger
- The Complete Guide to Heart Rate Training Zones After 40: Unlock Every Beat for Maximum Fat Loss, Endurance, and Longevity
- The Complete Guide to VO2 Max After 40: The #1 Predictor of Longevity and How to Improve It
- The Complete Guide to Concurrent Training After 40: How to Combine Cardio and Strength for Maximum Fat Loss, Muscle Preservation, and Longevity
- The Complete Guide to Walking and Rucking After 40: The Most Underrated Cardio for Fat Loss, Joint Health, and Longevity
- The Complete Guide to Designing Your Own Cardio Plan After 40: A Personalized Blueprint for Fat Loss, Longevity, and Peak Performance
- The Complete Guide to Cardio Nutrition After 40: Fuel Your Workouts for Maximum Fat Loss, Endurance, and Recovery
- The Complete Guide to Cardio Equipment After 40: Choosing the Best Treadmill, Bike, Rower, or Elliptical for Your Home Gym
- The Complete Guide to Injury Prevention for Cardio After 40: Run, Ride, and Ruck Pain-Free for Life
- The Complete Guide to Cardio for Fat Loss After 40: Burn Stubborn Belly Fat Without Losing Muscle or Energy
- The Complete Guide to Seasonal Cardio Training After 40: How to Periodize Your Year for Year-Round Fitness, Fat Loss, and Injury Prevention
- The Complete Guide to Cardio and Brain Health After 40: How Exercise Protects Your Memory, Mood, and Mental Sharpness
- The Complete Guide to Building a Home Gym for Cardio After 40: Design a Space That Makes Consistency Inevitable
- The Joyful Movement Manifesto: How to Love Cardio After 40 and Make It a Lifelong Practice
- The Complete Guide to Sleep and Cardio After 40: How Deep Rest Unlocks Your Best Performance, Recovery, and Longevity
- The Complete Guide to Stress, Cortisol, and Cardio After 40: How to Manage Your Nervous System for Better Recovery and Performance
- The Complete Guide to Returning to Cardio After a Layoff After 40: Your Compassionate, Science-Backed Roadmap Back to Fitness
- The Complete Guide to Cardio Through Menopause: How to Adapt Your Training for Hormonal Changes, Protect Your Heart, and Feel Strong After 40
- The Complete Guide to Cycling After 40: Low-Impact Cardio for Joint Health, Endurance, and Lifelong Fitness
- The Complete Guide to Pool and Water-Based Cardio After 40: Low-Impact Workouts for Joint Pain, Recovery, and Total-Body Fitness
- The Complete Guide to Rowing After 40: Full-Body, Low-Impact Cardio for Strength, Endurance, and Longevity
- The Complete Guide to Tracking Cardio Progress After 40: The Key Metrics That Matter More Than the Scale
- The Complete Guide to Cardio for High Blood Pressure After 40: How Exercise Lowers Your Numbers and Protects Your Heart
- The Complete Guide to Cardio for Type 2 Diabetes and Prediabetes After 40: How Exercise Reverses Insulin Resistance and Protects Your Heart
- The Complete Guide to Cardio with Arthritis After 40: Pain-Free Workouts That Strengthen Joints and Keep You Moving
- The Complete Guide to Longevity and Cardio After 40: How Aerobic Fitness Adds Years to Your Life and Life to Your Years
- The Complete Guide to Building a Cardio Habit After 40: The Science of Making Exercise Stick for Life
- The Complete Guide to Cardio and Immune Health After 40: Strengthen Your Body’s Defense System for a Resilient, Vibrant Life
- The Complete Guide to Cardio While Traveling After 40: Stay Fit on the Road, in Hotels, and Away from Home
- The Complete Guide to Cardio for Posture and Back Pain After 40: Strengthen Your Posterior Chain and Reverse the Damage of Sitting
- The Complete Guide to the Social Side of Cardio After 40: How Community, Accountability, and Connection Make You Stronger
- The VigorForty Manifesto: A Final Word on the Lifelong Practice of Movement