

Author: Vigor Forty Editorial Team
Medically Reviewed By: Editorial Review Board
Disclaimer: This article is for informational purposes only and is not a substitute for professional medical advice. Read our full Medical Disclaimer.
📌 Key Takeaways
- Tracking Is the Bridge Between Intention and Insight: You cannot manage what you don’t measure. After 40, the body sends silent signals—rising resting heart rate, creeping blood pressure, declining heart rate variability—that are invisible to the naked eye but crystal clear with a simple, consistent tracking routine.
- Eight Metrics Provide a 360-Degree View of Midlife Health: Resting heart rate, blood pressure, heart rate variability (HRV), sleep duration and quality, fasting blood glucose, waist circumference, body weight trend, and daily step count are the highest-yield markers for longevity and functional fitness. They cover cardiovascular, metabolic, inflammatory, and behavioral domains.
- Home Monitoring Often Beats the Doctor’s Office: White-coat hypertension and single-point-in-time measurements can mislead. A $40 upper-arm blood pressure cuff used 3 mornings per week is more predictive of cardiovascular outcomes than a rushed reading at an annual physical.
- Trend, Not Perfection, Is the Goal: A single high glucose reading or low HRV night means nothing. A 30-day trend does. The purpose of tracking is to catch the drift—slow, steady declines or improvements—so you can adjust your habits before a diagnosis forces your hand.
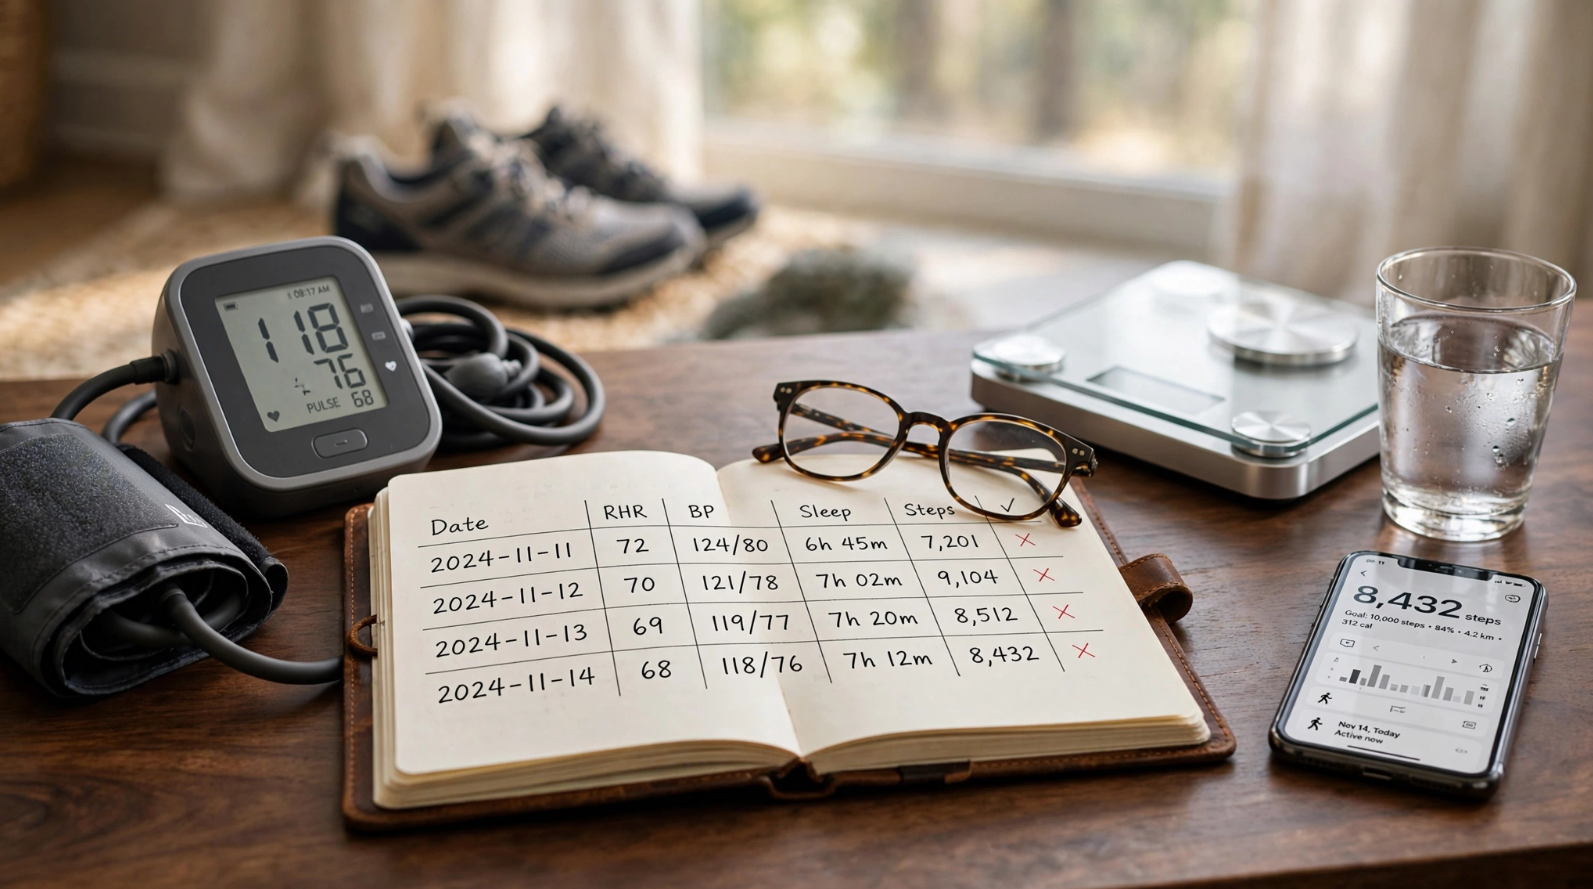
- You Can Start with Just Two Devices and a Notebook: No expensive wearable required. A blood pressure cuff, a digital scale, and a simple paper log can give you 80% of the insight needed to guide your supplement, exercise, and sleep habits. Add a wearable later as your comfort and curiosity grow.
Introduction: The Body Whispers Before It Screams
The 50-year-old American who “suddenly” has a heart attack didn’t suddenly develop heart disease. The pathology was brewing for decades. But the signs were there—if anyone had been looking. A resting heart rate that crept from 62 to 78 over five years. A blood pressure that sat at 128/82, just “high-normal” enough to ignore. A waistline that expanded two inches. A sleep score that never quite refreshed.
The problem isn’t a lack of data; our smartphones, watches, and rings are overflowing with it. The problem is knowing which numbers deserve your limited attention and how to translate them into action without falling into the rabbit hole of health anxiety. For the American over 40, who juggles career, family, and the first whispers of mortality, tracking must be simple, evidence-based, and ruthlessly practical.
This article identifies the eight metrics that offer the highest return on your tracking investment. Each one is linked to hard outcomes—heart attack, stroke, diabetes, frailty, all-cause mortality—and each can be measured at home, in minutes, without a medical degree. We’ll show you the target range, the minimal tracking frequency, the best tools (from $0 to $300), and exactly what to do when the trend line moves the wrong way. This is your midlife dashboard. Learn to read it, and you’ll drive your health with far greater control.
Section 1: Why These 8 Metrics? The Midlife Physiology Map
After 40, four interconnected systems begin to shift: cardiovascular, metabolic, autonomic nervous, and musculoskeletal. These eight metrics were chosen because they cross-monitor these systems and are proven predictors of disability-free lifespan.
The Four Systems at Play:
- Cardiovascular: Blood pressure, resting heart rate, HRV.
- Metabolic/Inflammatory: Fasting blood glucose, waist circumference, body weight trend.
- Autonomic & Recovery: HRV (again), sleep duration and quality.
- Behavioral Output: Daily step count.
Tracking a single metric gives you a snapshot; tracking this constellation gives you a movie. A rising fasting glucose alongside a declining HRV and increasing waist circumference is a powerful early warning for metabolic syndrome. A stable resting heart rate and excellent sleep duration but rising blood pressure isolates the problem to vascular stiffness and sodium sensitivity. This pattern-based insight allows you to target your interventions—supplements, diet shifts, exercise type—with precision rather than guesswork.
Section 2: The VigorForty 8 Metrics Dashboard
Here is the complete dashboard, presented in order of importance and ease of measurement.
Metric 1: Resting Heart Rate (RHR)
Why It Matters After 40:
RHR is a blunt but reliable indicator of cardiovascular fitness and autonomic nervous system balance. In large cohort studies, a RHR above 80 beats per minute is associated with significantly higher all-cause and cardiovascular mortality compared to a RHR below 70. A downward trend over months suggests improving cardiac efficiency; an upward trend can signal overtraining, chronic stress, poor sleep, or developing illness.
Target Range:
- Optimal: 55–65 bpm (well-trained individuals may be lower; 60–75 is a healthy range for most)
- Caution: Sustained resting rate >80 bpm warrants a discussion with your doctor.
How to Track:
- Method: Immediately upon waking, before getting out of bed, use a wearable (Apple Watch, Fitbit, Oura Ring) or place two fingers on your radial wrist artery and count beats for 30 seconds, then multiply by two.
- Frequency: Daily. Record a weekly average and watch the trend line monthly.
- Low-Tech Option: Manual count + notebook. It costs nothing and is highly accurate when done consistently.
Action Step if Trending Up:
Increase aerobic base training (long, slow zone-2 walks or cycling), prioritize 7–8 hours of sleep, reduce alcohol (a potent RHR elevator), and consider magnesium glycinate before bed. If unexplained, check thyroid function (TSH) with your physician.
Metric 2: Blood Pressure (BP)
Why It Matters After 40:
Hypertension is the single greatest modifiable risk factor for stroke, heart attack, kidney failure, and dementia. Nearly half of American adults have high blood pressure, and only about 1 in 4 have it under control. The updated 2017 ACC/AHA guidelines classify 120–129/<80 mmHg as “Elevated” and 130–139/80–89 as “Stage 1 Hypertension.” Damage to arteries begins well below the old 140/90 threshold.
Target Range:
- Optimal: <120/80 mmHg
- Acceptable: <130/80 mmHg for most
- Action: Consistently ≥130/80 mmHg is Stage 1 hypertension; lifestyle and potentially pharmacological intervention should be discussed.
How to Track:
- Method: Use a validated upper-arm cuff monitor (Omron is widely trusted). Sit quietly with feet flat, back supported, arm at heart level, for 5 minutes before taking a reading. Take two readings, one minute apart, and average them.
- Frequency: 3 mornings per week, and once per month in the evening for a diurnal picture.
- Avoid: Wrist-cuff monitors; they are highly sensitive to positioning and often inaccurate.
Action Step if Trending Up:
Reduce sodium to <2,300 mg daily (or <1,500 mg if hypertensive), increase dietary potassium (avocados, spinach, sweet potatoes), add 300–400 mg magnesium glycinate, and integrate daily aerobic movement (30-minute walk). The DASH diet is the gold standard. Recheck after 4 weeks of consistent lifestyle change before discussing medication with your doctor.
Metric 3: Heart Rate Variability (HRV)
Why It Matters After 40:
HRV is the variation in time between consecutive heartbeats, controlled by the autonomic nervous system. Higher HRV generally indicates a healthy balance between sympathetic (fight-or-flight) and parasympathetic (rest-and-digest) activity—a marker of resilience. HRV declines with age, but lifestyle powerfully influences it. A chronically low or declining HRV is associated with higher inflammation, cardiovascular disease risk, and even depression.
Target Range:
- There is no universal “good” number; it’s highly individual. The goal is a stable or rising personal baseline over time. For a 45-year-old, an overnight average of 30–50 ms (RMSSD) is typical; the absolute value matters less than the trend.
How to Track:
- Method: Requires a wearable with HRV capability—Oura Ring, Whoop, Apple Watch (with the Health app), or Garmin. These devices take readings automatically during sleep or upon waking.
- Frequency: Check your overnight average daily, but only act on 7-day trends. Do not overreact to a single bad night of sleep or a glass of wine.
- Low-Tech Alternative: None truly equivalent; this is a metric where wearables shine.
Action Step if Trending Down:
A declining HRV trend often signals accumulated stress, insufficient recovery, or alcohol consumption. Implement a wind-down routine (dim lights, no screens 60 minutes before bed), reduce high-intensity exercise temporarily, eliminate alcohol for two weeks, and add a breathwork practice (5 minutes of 4-second inhale/6-second exhale). If HRV remains suppressed, prioritize a medical checkup to rule out occult inflammation or sleep apnea.
Metric 4: Sleep Duration & Quality
Why It Matters After 40:
Sleep is the master regulator of metabolic health, cognitive function, hormonal balance, and immune surveillance. After 40, sleep architecture naturally changes—deep sleep decreases, nocturnal awakenings increase. However, chronic short sleep (<6 hours) is independently linked to obesity, insulin resistance, hypertension, and dementia. It also destroys willpower, making healthy habits far harder to sustain.
Target Range:
- 7–8 hours of actual sleep time, not just time in bed.
- Subjective quality rating of 4 or 5 out of 5 (feeling rested).
How to Track:
- Method: A wearable (Oura, Fitbit, Apple Watch) that tracks sleep stages is helpful, but a simple notebook with two columns is equally effective: (1) Total Sleep Hours, (2) Morning Rating (1-5). The subjective rating often correlates well with objective recovery.
- Frequency: Daily. Record the numbers without judgment; look for patterns linking late bedtimes, alcohol, or late meals to poor scores.
Action Step if Sleep Is Short or Poor:
The first lever is a consistent wake-up time (even on weekends) to anchor the circadian rhythm. The second is a dark, cool (65°F) bedroom. Third, eliminate caffeine after 12 PM and alcohol within 3 hours of bed. If sleep remains unrefreshing despite 7+ hours, discuss a sleep apnea screen with your doctor—prevalence rises sharply after 40, especially with weight gain.
Metric 5: Fasting Blood Glucose (FBG)
Why It Matters After 40:
Fasting blood glucose is the canary in the metabolic coal mine. By the time an American is diagnosed with type 2 diabetes (FBG ≥126 mg/dL), they have typically spent years with rising insulin resistance and impaired glucose tolerance. An optimal FBG is below 95 mg/dL. Levels between 100–125 mg/dL indicate prediabetes—a window where lifestyle change can completely reverse the trajectory.
Target Range:
- Optimal: 70–90 mg/dL
- Acceptable: 90–99 mg/dL
- Prediabetes: 100–125 mg/dL
- Diabetes: ≥126 mg/dL (on two separate tests)
How to Track:
- Method: A basic glucometer (Contour Next, Accu-Chek) with a finger-prick test, performed after an 8-hour overnight fast. A single drop of blood gives a reading in seconds. Alternatively, annual labs through your physician.
- Frequency: If normal, 1–2 times per month is sufficient. If borderline, 2–3 times per week, varying the days, to establish a reliable average. If prediabetic, consider a continuous glucose monitor (CGM) trial for 2–4 weeks to see how your unique body responds to meals.
Action Step if Trending Up:
The most powerful intervention is a post-dinner walk (15–30 minutes), which directly shuttles glucose into muscle cells without requiring extra insulin. Reduce liquid sugar (soda, juice, sweetened coffee), increase fiber (vegetables, legumes), and ensure adequate protein at breakfast. If FBG remains elevated, discuss HbA1c and fasting insulin with your doctor for a more complete picture of insulin resistance.
Metric 6: Waist Circumference
Why It Matters After 40:
Waist circumference directly measures visceral adipose tissue—the metabolically active fat packed around internal organs that drives inflammation, insulin resistance, and cardiovascular risk. It is often a better predictor of metabolic disease than BMI. For Americans over 40, waist size tends to expand insidiously even if total body weight remains stable, because muscle mass is slowly declining and being replaced by fat.
Target Range:
- Men: <40 inches (102 cm)
- Women: <35 inches (88 cm)
- For optimal health, aim for <37 inches (men) and <31.5 inches (women).
How to Track:
- Method: Use a flexible cloth tape measure. Stand, exhale gently, and measure at the level of the navel (not the narrowest point). Keep the tape horizontal and snug but not compressing.
- Frequency: Once per month, on the same day of the month, in the morning before eating.
Action Step if Trending Up:
This is a direct signal to improve body composition. Prioritize protein intake (1.6–2.0 g/kg of body weight daily), consistent resistance training (2–3 sessions per week), and daily walking. Reduce ultra-processed foods and alcohol. Even a 2-inch reduction in waist circumference yields significant improvements in inflammatory markers.
Metric 7: Body Weight Trend (Weekly Average)
Why It Matters After 40:
Body weight alone is noisy—it fluctuates daily by 2–5 pounds due to water, glycogen, and gut content. What matters is the weekly average trend over months. Weight creep of just 2–3 pounds per year compounds into a 20-pound gain over a decade, silently driving metabolic dysfunction and joint strain.
Target Range:
- Stability within a 3–5 pound range year over year. If overweight, a slow, deliberate reduction of 0.5–1.0% of body weight per week (e.g., 1–2 pounds per week for a 200-pound individual) is sustainable.
How to Track:
- Method: Digital scale, placed on a hard, flat surface. Weigh yourself first thing in the morning, after using the bathroom, before eating or drinking, wearing minimal clothing. Record the number in a notebook or app.
- Frequency: 3–7 days per week. Calculate a weekly average every Sunday. Only compare the weekly averages to spot the true trend.
Action Step if Trending Up Unintentionally:
Track food intake for just 3 days (including one weekend day) to identify hidden calorie sources—liquid calories, cooking oils, condiments, mindless snacking. Increase daily step count by 2,000 steps. The goal is not sudden crash dieting; it’s identifying the small daily surplus that accumulated over months.
Metric 8: Daily Step Count
Why It Matters After 40:
Step count is the simplest proxy for non-exercise activity thermogenesis (NEAT)—all the movement you do outside of formal exercise. Large epidemiological studies show a clear inverse relationship: mortality risk drops sharply between 4,000 and 8,000 steps per day, with benefits continuing to about 10,000 steps. It requires no gym, no sweat, and can be woven invisibly into the American day.
Target Range:
- Minimum: 7,000 steps/day
- Optimal: 8,000–10,000 steps/day
- Beyond 10,000 offers diminishing but still positive returns.
How to Track:
- Method: Smartphone (built-in pedometer), simple clip-on pedometer, or wearable. The phone in your pocket is surprisingly accurate and costs nothing.
- Frequency: Daily. Track a rolling 7-day average. Don’t judge a single low day; watch the weekly trend.
Action Step if Consistently Low:
Use the environment design principles from our Habit Design article: park farther from store entrances, take walking meetings, pace during phone calls, set a timer to stand and walk for 2 minutes every hour. One 15-minute walk after dinner plus small micro-movements can easily add 3,000–4,000 steps to a baseline day.
Section 3: The VigorForty Minimal Tracking Protocol
You don’t need to track all eight metrics with daily precision. Start with the “Core Four” and add layers as these become automatic habits.
Tier 1—Start Here (Core Four):
- Blood Pressure (3x/week, morning)
- Resting Heart Rate (daily, upon waking)
- Body Weight (daily, weekly average)
- Step Count (daily, aim for 7,000+)
Tools needed: Upper-arm cuff ($40), digital scale ($25), smartphone or $10 pedometer. Total cost: under $75.
Tier 2—Add After Tier 1 Is Habitual:
- Waist Circumference (monthly)
- Sleep Duration & Quality (daily notebook or wearable)
Tier 3—Precision Tracking (Optional, for those who enjoy data):
- HRV (requires wearable like Oura or Whoop)
- Fasting Blood Glucose (requires glucometer, ~$30)
The Sunday Review Habit:
Once a week, on Sunday morning, spend 10 minutes reviewing the past week’s data. Write down your weekly averages for RHR, BP, weight, and step count in a dedicated health journal. Note any correlations: “Three late nights, RHR up 4 bpm, sleep score low.” This ritual transforms raw data into actionable wisdom and reinforces your identity as someone who stewards their health.
Section 4: FAQ—Your Top Metrics Tracking Questions
Q: I get anxious just thinking about tracking numbers. How do I avoid becoming obsessed?
A: Set a firm boundary: you check each metric exactly as prescribed and then move on. No checking blood pressure five times in a row, no stepping on the scale after every meal. The goal is trend awareness, not moment-to-moment control. If numbers trigger significant anxiety, start with the Seinfeld calendar method (just mark an X if you took your BP that day) without even recording the value. Gradually add the actual number once the checking habit feels neutral.
Q: My doctor says my blood pressure is fine in the office, but at home it’s sometimes high. Which do I trust?
A: Trust the home readings, provided you’re using proper technique. White-coat hypertension (elevated in-office) is common, but masked hypertension (normal in-office, elevated at home) is more dangerous because it goes undetected. Share your home log with your doctor. Many physicians now base treatment decisions on home readings because they better predict outcomes.
Q: I’m a woman over 50. Do these metrics apply to me equally?
A: Yes, but with nuance. Menopause brings hormonal shifts that can affect several metrics: blood pressure may rise, HRV may decline, waist circumference tends to increase even at stable weight. The targets remain the same, but the pace of change may accelerate. HRT, if appropriate for you, can positively influence these metrics. Discuss with your physician. The act of tracking becomes even more important during this transition to catch rapid changes.
Q: Can my Apple Watch really track blood pressure?
A: Not directly. Current Apple Watch models do not have a blood pressure cuff or sensor. They can estimate trends via pulse arrival time in some research settings, but for clinical accuracy, an upper-arm cuff is required. Wearables excel at RHR, HRV, sleep tracking, and step count. Blood pressure and blood glucose still require dedicated devices.
Q: I’m on medication that affects my heart rate (beta blockers). Is tracking RHR still useful?
A: Yes, but interpret it differently. Beta blockers artificially lower RHR. For you, RHR tracking is useful to monitor medication adherence and consistency. A sudden rise in RHR could indicate a missed dose or other issue; a very low RHR (below 50 bpm) with symptoms like dizziness or fatigue warrants a medication review with your doctor.
The VigorForty Take
Your body is constantly generating data about its internal state. After 40, tuning into this data stream is not hypochondria—it is responsible adult stewardship of the only vessel you get. The eight metrics in this dashboard are not arbitrary numbers; they are the dials on the control panel of your cardiovascular, metabolic, and nervous systems. When you track them simply, consistently, and without obsession, you transform from a passive passenger into the pilot of your own health.
Start small. Buy a blood pressure cuff. Step on the scale tomorrow morning and write down the number. Count the beats of your pulse before coffee. These tiny acts of measurement, strung together over weeks and months, become a powerful narrative of where you’ve been and where you’re heading. And when the trend line moves the wrong way—as it sometimes will—you’ll have the early warning and the evidence-based tools to correct course long before a crisis forces your hand.
Your midlife dashboard is ready. All it needs is your daily attention for a few minutes a week. The insights you gain will pay dividends measured not just in years, but in the vibrant, energetic decades of life those years contain.
Read All Related Articles
- The Complete Guide to Heart Health: Beyond Omega-3s—CoQ10, Magnesium, Potassium, and Nitric Oxide Support After 40
- The Complete Guide to Habit Design After 40: Building Sustainable Health Routines and Tracking What Matters
- The 8 Health Metrics Every American Over 40 Should Track (And How to Do It Without Obsession)
- Habit Stacking for Busy Americans: A 10-Minute Morning Routine That Actually Sticks
- Sleep Tracking Demystified: How to Use Your Apple Watch/Oura Ring to Wake Up Refreshed
- Habit Design 101: Why You Fail (And the Tiny Fix That Changes Everything)
- From Couch to Consistent: The 30-Day ‘Exercise Snack’ Habit Plan
- The Mediterranean Diet Habit Blueprint (For Americans Who Hate Meal Prep)
- HRV Explained: Why It Matters and How to Improve It Without Chasing Numbers
- Whoop vs. Oura vs. Fitbit: Which Health Tracker Fits Your Lifestyle?
- How to Keep Your Health Habits Alive During BBQ & Travel Season
- 5-Minute Poolside/Patio Workouts (No Equipment, No Sweat)
- Half-Year Habit Audit: A Simple Framework to Review What’s Working
- Reader Stories: 3 Americans Who Transformed Their Health with One Tiny Habit